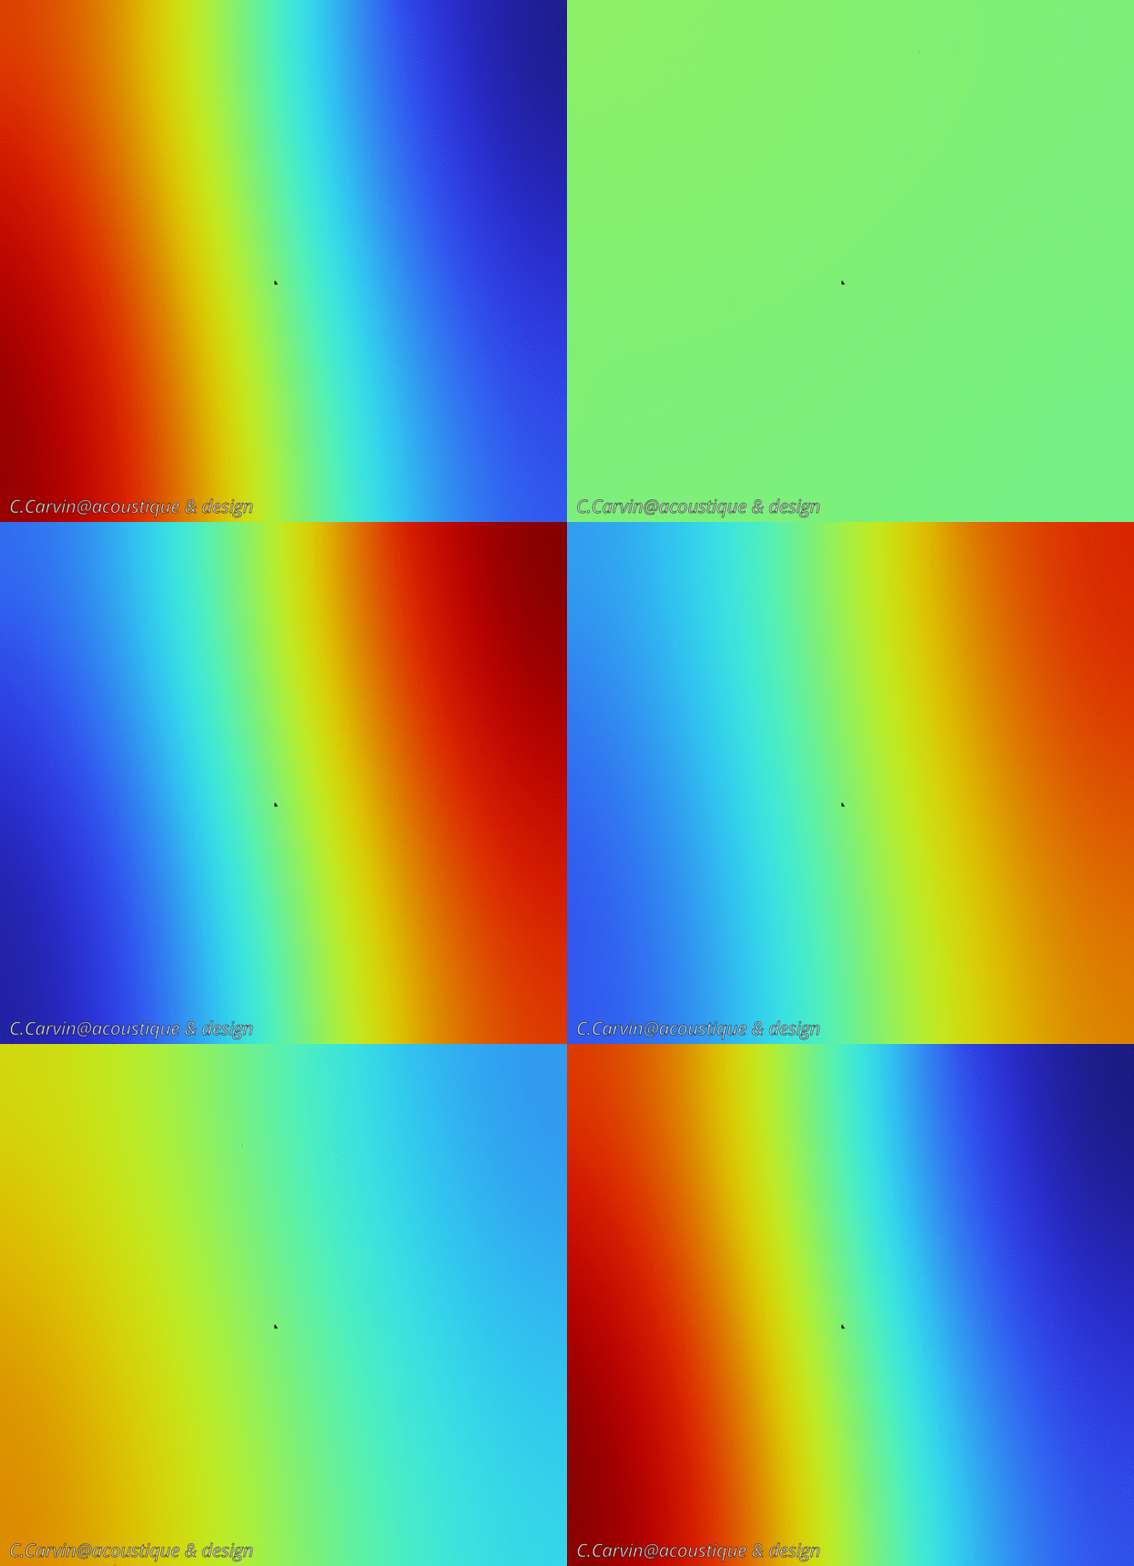
Here is an other example of spatial pressure distribution over time in a 3m x 3m room at steady state, with excitation originating from a source positioned in the lower-left region. In such rooms, there is a high likelihood that your mixing position will be situated at the center of the square (represented by a black dot).
The hearing mechanism involves a temporal integration of pressure. In this animation, you can observe that the mix position remains in green color, indicating a constant pressure value equal to zero over time.
This implies an absence of sound: the air particles are not moving back and forth at this point, making this issue impossible to address using active corrections.
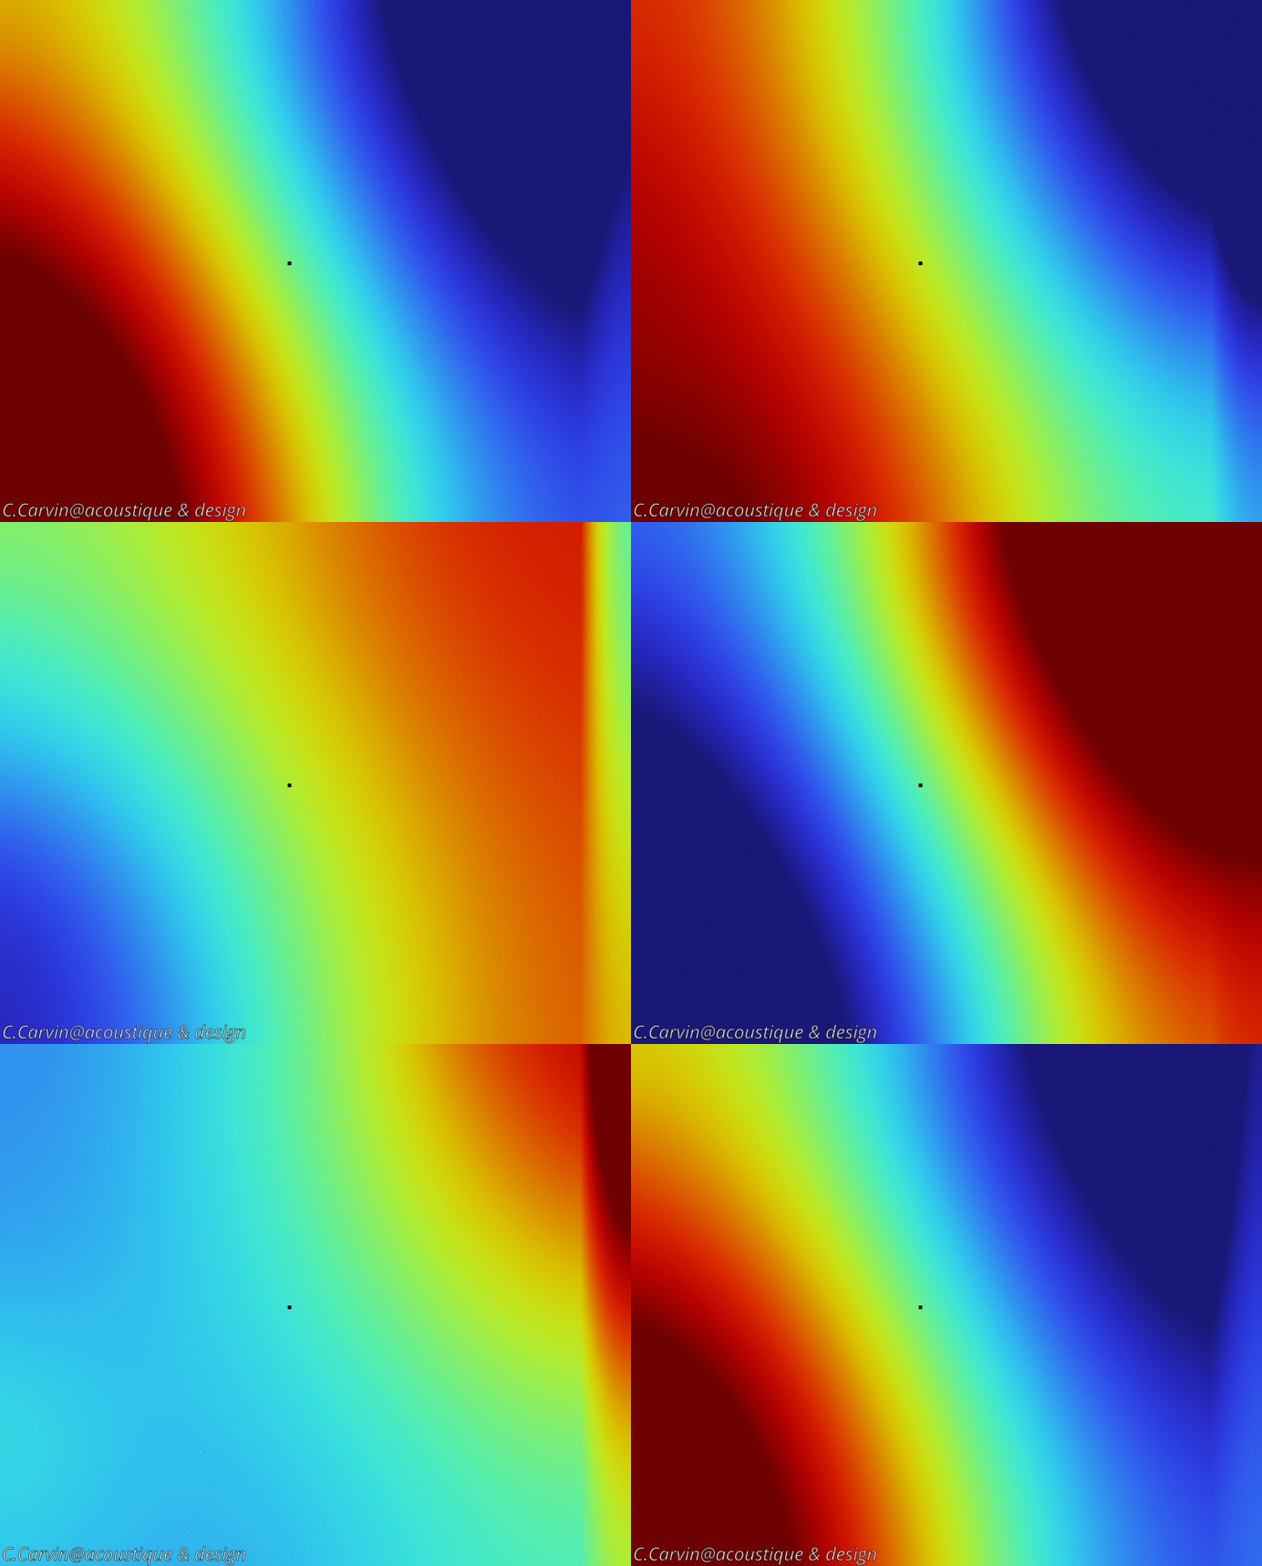
The second animation is an example of spatial pressure distribution over time in the same room with acoustic treatment. You can see the color changing from green to orange at mixing point. (Please note that the amplitude color range differs from the original post) This approach allows me to enlarge the sweet zone.
It’s a kind of magic!
Spatial pressure distribution over time at steady state in a 3mx3mx3m untreated room:

Spatial pressure distribution over time at steady state in a 3mx3mx3m treated room:

